30/03/2023
New! Behaviour and achievement analytics
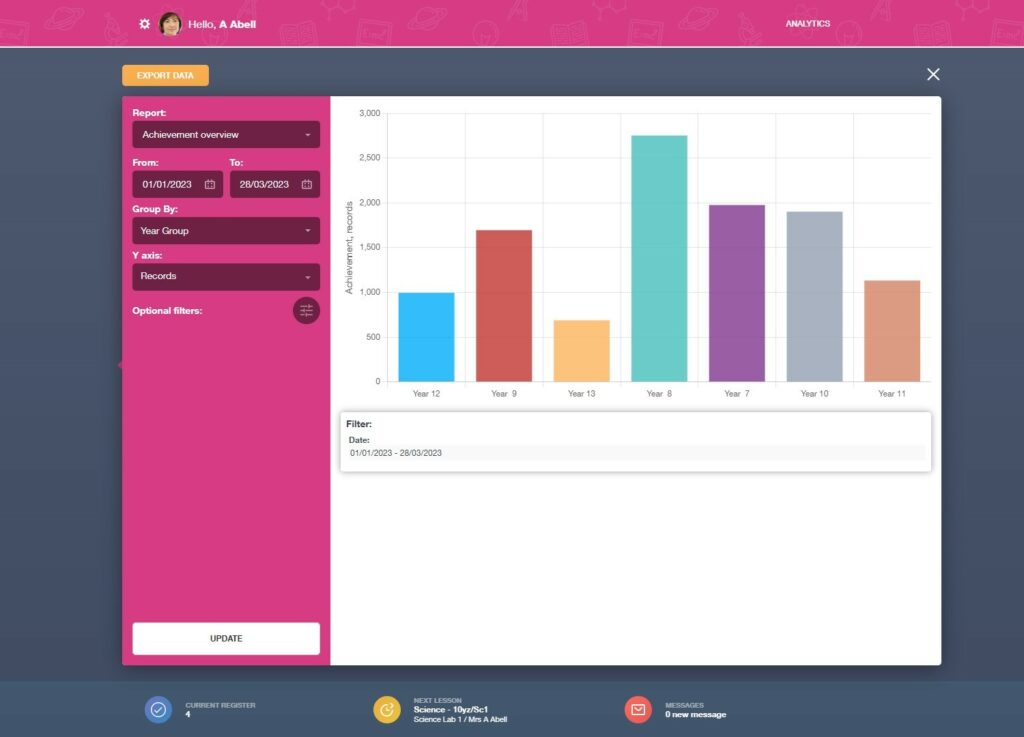
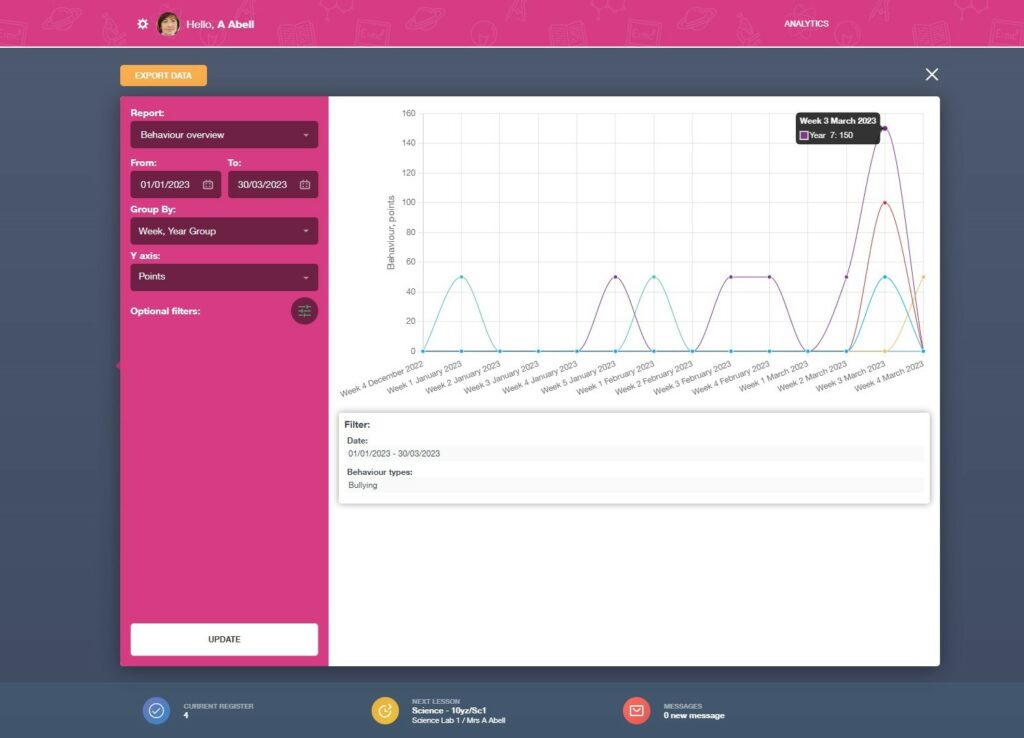
You can now analyse behaviour and achievement points in Edulink One with our new Analytics reports.
The new reports, which are now available under the Analytics tab in Edulink, allow you to view information and statistics on behaviour and achievement points and records, as well as drill down into the data to better understand what’s going on.
Available Filters
You can analyse by using the “group by” filter for the date range you require, and select up to 3 filters at any time including:
- Activity Type (English, Geography etc.)
- Form Group
- Gender
- House Group
- Month
- Pupil Premium
- SEN Status
- Student
- Week
- Year Group
For the full range, click here. Both achievement and behaviour reports have the same set of filters.
Graph Options
The new reports also give you the flexibility to choose how you’d like to analyse your points.
You can set up your graphs to report based on either the number of achievement records (e.g. merit, outstanding effort etc.) or the number of points.
Optional Filters
A comprehensive range of filters has been built-in to help you drill down into your data. For example, you could look at the number of achievement points by house, by gender or by employee. You can view the list of optional filters here.
Additionally, you can also exclude certain data sets e.g. pupil premium, SEND etc. to enable a detailed analysis of your school’s behaviour or achievement performance.
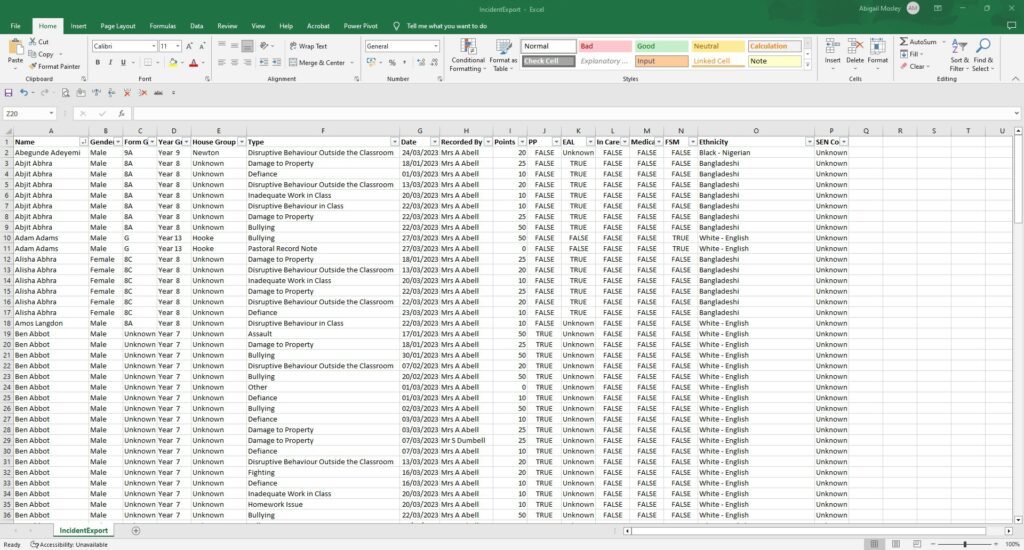
Exportable data
To give you greater reporting flexibility, the data for is also available to export to a .csv file. You can then utilise for any additional analytics you require in Excel, Power BI or similar.
Sounds great! How do I get them?
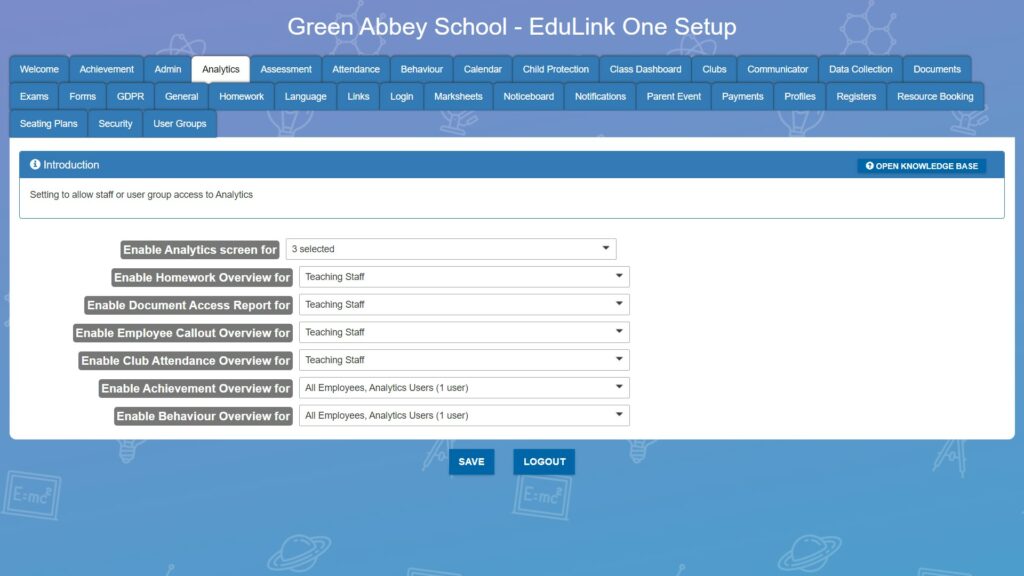
Enabling these new reports is simple. Your Edulink One administrator needs to go to the Analytics tab in the admin screen, enable both the Achievement Overview and Behaviour Overview options and allocate access (Read how to do this here). Then you’re good to go!
Want to learn more?
Read our Knowledge Hub articles for full information and “how-to” guides on how to use the new analytics reports.